| Model | YE0268 |
| Type | Reflectance |
| Size | Custom Designs |
| Ratio | 4:3/3:2 |
| Material | HD photographic paper |
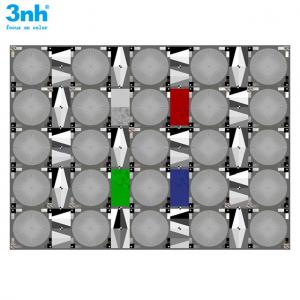
The YE0268 is designed for resolution and sharpness measurements. 25 sinusoidal modulated Siemens stars, 16 slanted edges at four different contrasts, four colored dead leaves structures and rope structure images are placed on the chart. A very detailed analysis over nine different image heights is possible with this chart. The chart has an aspect ratio of 4:3 or 3:2. It is suitable for systems from 2 MP up to 180 MP.
Five different structures in the chart allow a numerical and visual analysis:
• 25 sinusoidal Siemens stars are placed at the chart. The stars have a gray value which changes sinusoidal when walking on a circle around the center of the star.
• Each star is surrounded by 16 gray patches to do an OECF measurement. This information can be used to linearize the image data.
• 16 slanted edges with a contrast of 100, 80, 60 and 40 percent are placed between the stars.
• Four dead leaf patterns (gray, red green, blue) with reference patches are placed close to the center of the image.
• Images of ropes in the four corners and near the center
The chart structures follow the recommendation of ISO standard ISO12233.
According to ISO12233 the sixteen slanted edges can be used to determine the modulation and the limiting frequency. The analysis of the sharpening can also be done with these structures.
Dead leaves patches complete the resolution measurement. They are circular structures with random diameters and gray levels.The structures are constructed to do resolution measurements for different colors.
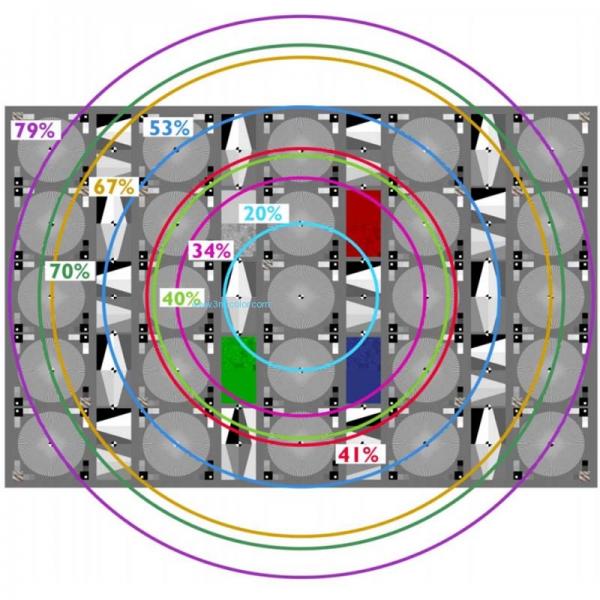
At the YE0268 test chart the number of Siemens stars is increased from nine to twenty-five to get a more detailed information about the image area.The resolution could be determined at these image heights (in %): 0.00 – 0.20 – 0.34 – 0.41 – 0.53 – 0.67 – 0.70– 0.79. So there is a definitely improved amount of information about the contrast behavior of the system at different image heights.
The YE0268 is designed for resolution and sharpness measurements. 25 sinusoidal modulated Siemens stars, 16 slanted edges at four different contrasts, four colored dead leaves structures and rope structure images are placed on the chart. A very detailed analysis over nine different image heights is possible with this chart. The chart has an aspect ratio of 4:3 or 3:2. It is suitable for systems from 2 MP up to 180 MP.
Five different structures in the chart allow a numerical and visual analysis:
• 25 sinusoidal Siemens stars are placed at the chart. The stars have a gray value which changes sinusoidal when walking on a circle around the center of the star.
• Each star is surrounded by 16 gray patches to do an OECF measurement. This information can be used to linearize the image data.
• 16 slanted edges with a contrast of 100, 80, 60 and 40 percent are placed between the stars.
• Four dead leaf patterns (gray, red green, blue) with reference patches are placed close to the center of the image.
• Images of ropes in the four corners and near the center
The chart structures follow the recommendation of ISO standard ISO12233.
According to ISO12233 the sixteen slanted edges can be used to determine the modulation and the limiting frequency. The analysis of the sharpening can also be done with these structures.
Dead leaves patches complete the resolution measurement. They are circular structures with random diameters and gray levels.The structures are constructed to do resolution measurements for different colors.
At the YE0268 test chart the number of Siemens stars is increased from nine to twenty-five to get a more detailed information about the image area.The resolution could be determined at these image heights (in %): 0.00 – 0.20 – 0.34 – 0.41 – 0.53 – 0.67 – 0.70– 0.79. So there is a definitely improved amount of information about the contrast behavior of the system at different image heights.
The maximum resolution of the TE268 A depends on chart size and diameter of the center mark:
| chart name | size | number of cycles | diameter center mark | min.resolution | max.resolution |
| YE0268-H | A1066 | 144 | 5 mm | 8 M | 180 MP |
| YE0268-A460-H | A460 | 144 | 5 mm | 2 MP | 35 MP |
The chart is available in 4:3 and 3:2.